Waist Size Chart for Women: Healthy Measurements by Height
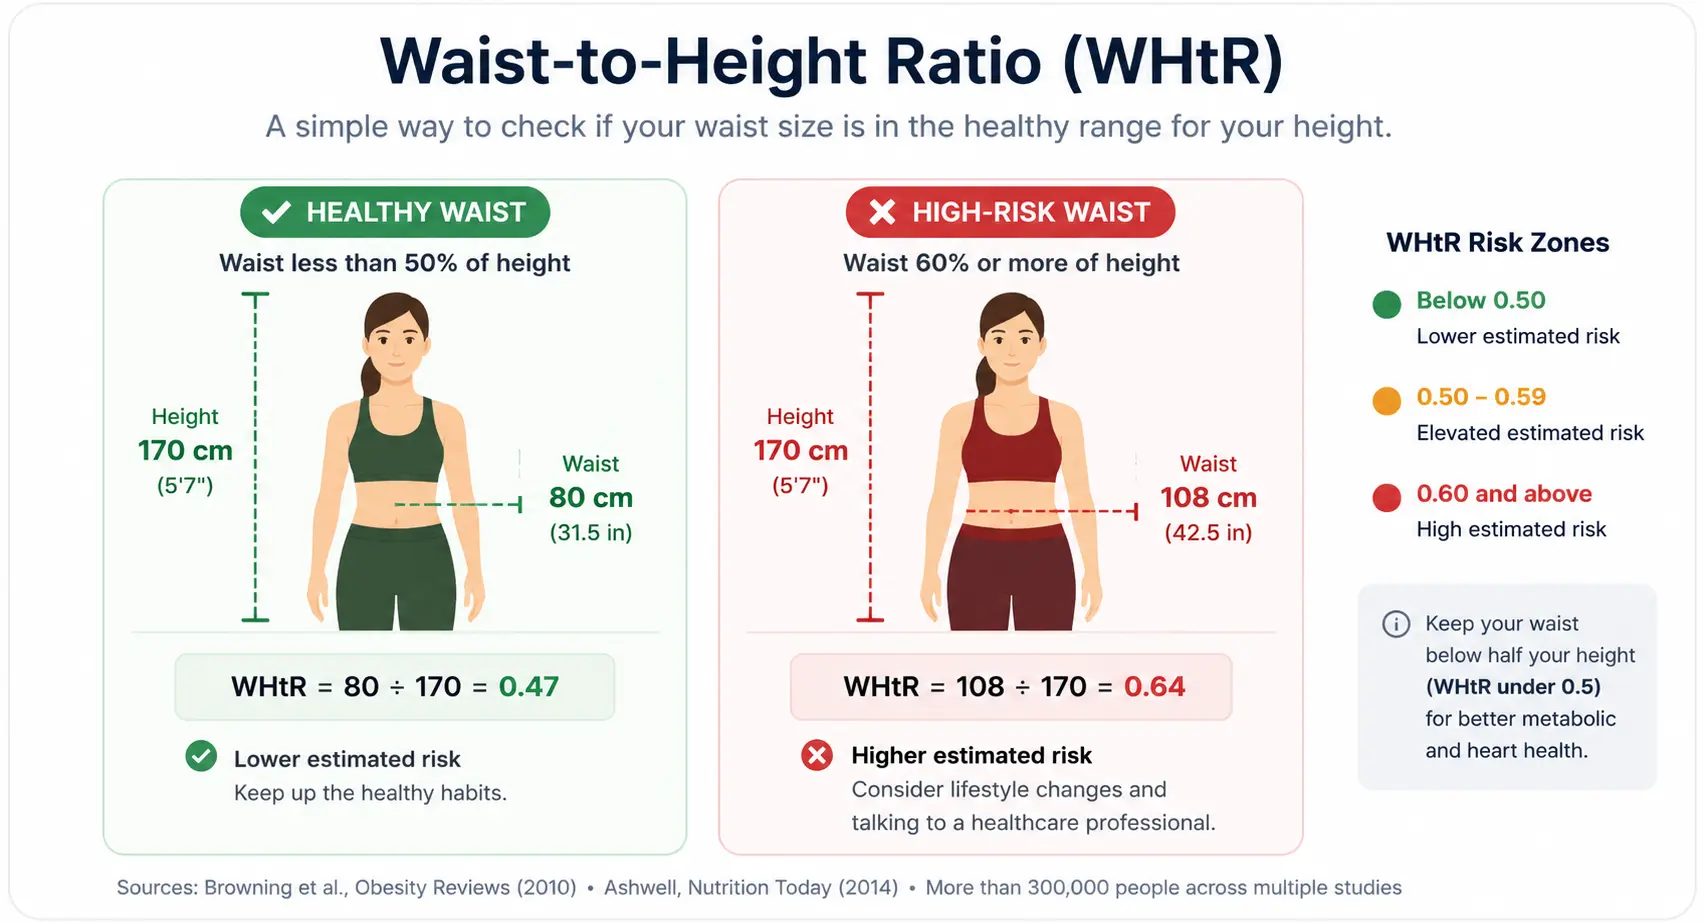
For adults, a simple waist-to-height target is to keep your waist below half your height. For example, at 160 cm (5'3"), that corresponds to about 80 cm (31.5 in); at 170 cm (5'7"), about 85 cm (33.5 in). The chart below shows the numbers by height and also explains how they compare with commonly used fixed waist-circumference thresholds.
Unlike BMI, waist circumference provides information about abdominal fat distribution, which is associated with cardiometabolic risk including insulin resistance and cardiovascular disease.
Waist size chart for women by height
The chart below shows target, increased, and high-risk waist zones for common heights, based on waist-to-height ratio (WHtR). The green segment is your target zone.
Printable waist size chart for women
Green = target (WHtR < 0.5) · Amber = increased (0.5–0.59) · Red = high risk (≥ 0.6)
The same data in table form (metric):
| Height | Height (ft'in") | Target waist (WHtR < 0.5) | Increased (0.5–0.59) | High risk (≥ 0.6) |
|---|
Printable waist size chart for women — imperial (inches)
Green = target (WHtR < 0.5) · Amber = increased (0.5–0.59) · Red = high risk (≥ 0.6)
| Height | Height (cm) | Target waist (WHtR < 0.5) | Increased (0.5–0.59) | High risk (≥ 0.6) |
|---|
See your exact number
Enter your height below for your personalized target waist range, in both cm and inches.
Average waist size vs. target waist size
A lot of people searching for a waist size chart are really asking what's average — but average isn't the same question as target, and it's worth keeping the two apart. Recent CDC data [3] puts the average waist circumference for adult women in the US at 38.5 in (97.9 cm).
Quick facts
Average U.S. adult woman: 38.5 in (97.9 cm) waist
This is a population average, not a recommended target. [3]
If your waist is close to the population average, you may still be well above your personal target — especially if you're on the shorter side. A rising average simply reflects where most people currently are, not where it's healthiest to be.
Common waist thresholds: 80 cm and 88 cm
Traditional waist-circumference guidelines use fixed sex-specific thresholds. For women, 80 cm (31.5 in) and 88 cm (about 35 in) are commonly used risk thresholds [4]: 80 cm is associated with increased health risk, and 88 cm with substantially increased risk. In the US, a waist above 35 inches (about 88 cm) is similarly cited as a risk marker for women [5]. These are useful screening cutoffs, but because they do not account for height, waist-to-height ratio offers an additional way to put your measurement in context. Our healthy waist size calculator is built around this exact idea.
Why height matters: the waist-to-height ratio (WHtR) method
WHtR is simply your waist circumference divided by your height. A 2010 systematic review by Browning, Hsieh, and Ashwell covering 78 studies [1] found WHtR to be a useful screening measure for diabetes and cardiovascular risk, and concluded that 0.5 could be a suitable global boundary value. A 2014 actuarial validation by Ashwell [2] supported the same boundary in large, diverse populations. Guidelines vary in how finely they categorize WHtR: NICE, for example, treats 0.4–0.49 as a healthy range, 0.5–0.59 as increased central adiposity, and 0.6 and above as high central adiposity [6] — broadly consistent with the target, increased, and high-risk zones used throughout this page. You can run the full calculation any time with the waist-to-height ratio calculator.
The table below shows how the fixed 88 cm (34.5 in) threshold compares with the height-adjusted target from waist-to-height ratio:
| Height | Fixed threshold (88 cm / 34.5 in) |
Height-adjusted target (WHtR < 0.5) |
Difference |
|---|---|---|---|
| 150 cm (4'11") | 88 cm (34.5 in) | < 75 cm (29.5 in) | WHtR threshold is 13 cm (5 in) lower |
| 160 cm (5'3") | 88 cm (34.5 in) | < 80 cm (31.5 in) | WHtR threshold is 8 cm (3 in) lower |
| 170 cm (5'7") | 88 cm (34.5 in) | < 85 cm (33.5 in) | WHtR threshold is 3 cm (1 in) lower |
| 180 cm (5'11") | 88 cm (34.5 in) | < 90 cm (35.5 in) | WHtR threshold is 2 cm (1 in) higher |
| 190 cm (6'3") | 88 cm (34.5 in) | < 95 cm (37.5 in) | WHtR threshold is 7 cm (3 in) higher |
The two methods can classify the same waist measurement differently, especially at shorter or taller heights. WHtR adds height to the calculation, while fixed waist-circumference thresholds use the same cutoff within each sex.
How to measure your waist correctly
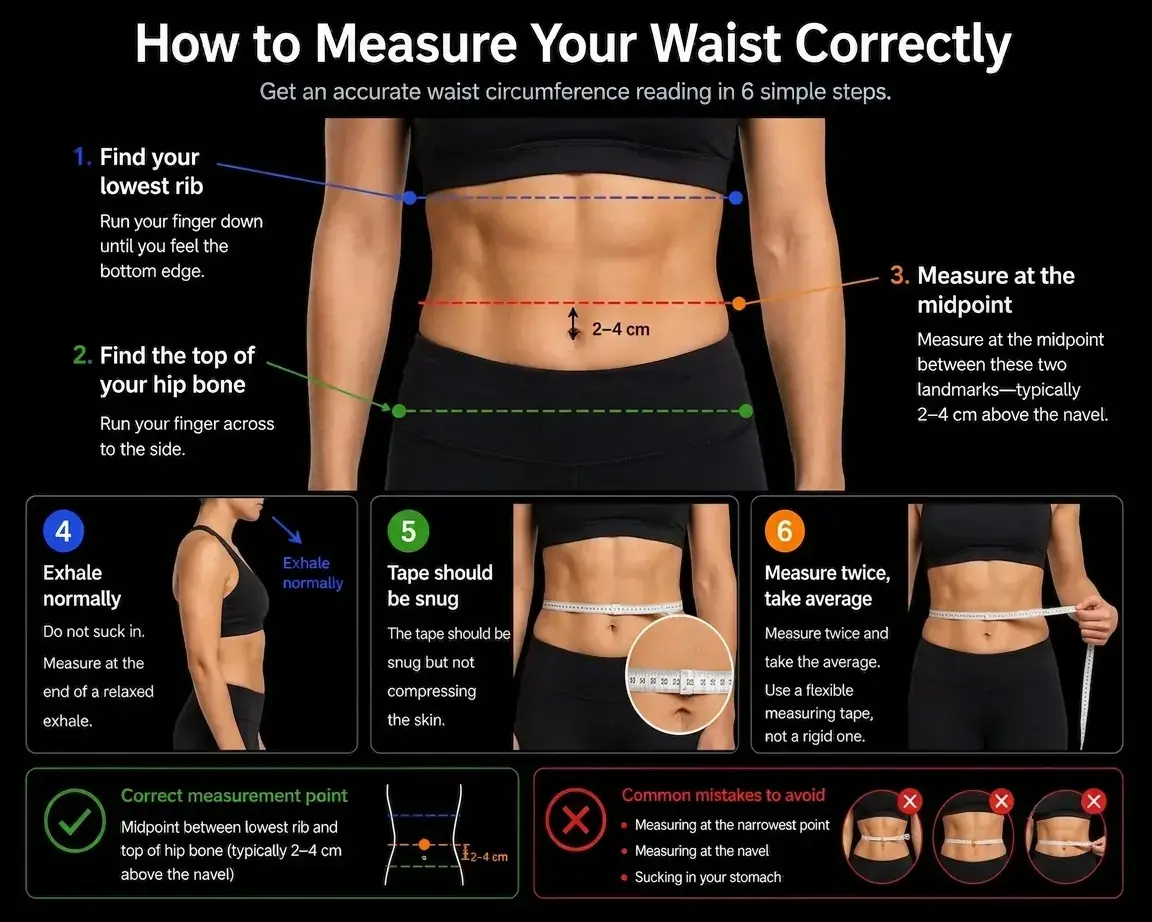
Find the midpoint between your lowest rib and the top of your hip bone (iliac crest) — usually a couple of centimeters above the navel, not the narrowest point of your torso and not the navel itself. Stand upright, breathe out normally without pulling your stomach in, and wrap the tape horizontally around your body, snug against the skin but not compressing it. Measure in the morning before eating for the most consistent results, and take it over bare skin or a single thin layer rather than over clothing.
Waist size and hormonal changes in women
Fat distribution isn't static across a woman's life. Body-fat distribution often changes through midlife and menopause, with many women experiencing greater abdominal fat accumulation, sometimes without a large change in overall weight or BMI. This is one reason waist measurement is a particularly useful number for women to track through midlife: the scale and BMI can both stay flat while central fat quietly increases.
Waist size can also fluctuate around pregnancy, postpartum recovery, and hormonal conditions like PCOS, which is independently associated with central fat accumulation. None of this changes the underlying target — WHtR below 0.5 — but it's worth remeasuring periodically rather than relying on a single measurement taken years ago.
What if your waist is above your target range?
A waist above your target range is a signal worth paying attention to, not a diagnosis. It means your statistical risk for cardiometabolic issues may be elevated — it doesn't mean anything is currently wrong. If your waist measurement is elevated or you have other metabolic risk factors, consider discussing it with a healthcare professional. They may recommend tests such as fasting glucose, HbA1c, triglycerides, or HDL cholesterol depending on your individual risk profile.
Small changes matter. Reductions in waist circumference often accompany improvements in cardiometabolic health, so progress can still matter even before you cross a particular threshold. You don't need to reach the target in one move — any reduction toward it is beneficial.
This chart only uses height. For a fuller picture, the free Body Roundness Index calculator and Conicity Index add two more validated angles on central fat.
Try the full InResRisk calculator →Frequently asked questions
Related
Key references
[1] Browning LM, Hsieh SD, Ashwell M. A systematic review of waist-to-height ratio as a screening tool for the prediction of cardiovascular disease and diabetes: 0.5 could be a suitable global boundary value. Nutrition Research Reviews. 2010;23(2):247–269. PMID 20819243
[2] Ashwell M. Waist-to-height ratio as a screening tool for cardiovascular risk. Nutrition Today. 2014;49(2):63–67. PMC4800150
[3] Fryar CD, Gu Q, Afful J, Carroll MD, Ogden CL. Anthropometric Reference Data for Children and Adults: United States, August 2021–August 2023. National Center for Health Statistics. Vital Health Stat 3(50). 2025.
[4] World Health Organization. Waist Circumference and Waist-Hip Ratio: Report of a WHO Expert Consultation, Geneva, 8–11 December 2008. Geneva: WHO; 2011.
[5] National Heart, Lung, and Blood Institute. Clinical Guidelines on the Identification, Evaluation, and Treatment of Overweight and Obesity in Adults: The Evidence Report. NIH Publication No. 98-4083. 1998.
[6] National Institute for Health and Care Excellence (NICE). Overweight and obesity management (NG246): Identifying and assessing overweight, obesity and central adiposity. 2025.
This chart only uses height. The complete InResRisk assessment adds Body Roundness Index, Conicity Index, and BMI for the full picture.
Try the full InResRisk calculator →